|
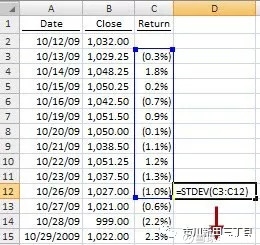
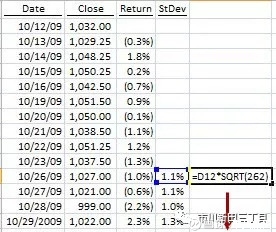
How Do You Calculate Volatility In Excel? by AdamHGrimes I received a question from a reader who asked, ��Can you calculate volatility in Excel?�� The answer is, yes you can, but there are a few things you need to know. Without going into too much detail here, there are many ways to calculate volatility. Two of the most common measures are impliedand historical (also called realized or statistical) volatility. It is fairly simple to calculate historical volatility in excel, and I will show you how in this post. Calculating implied is quite a bit more complicated. You technically cando it in excel, but you have to impute it from an option price. In addition, there��s actually a volatility surface, or different values of implieds for different strike prices and maturities. That��s a topic for another day; today let��s just look at how to calculate a simple historical volatility in Excel. ��λ�������ҡ�����Excel������ʷ�������𣿡����ǿ��ԣ���Ȼû���⣬���м�������Ҫ�˽�һ�¡����㲨���ʵķ����кܶ࣬�ڴ˲�һһ����������������Ҫ�������������ʺ���ʷ�����ʣ���ʷ������Ҳ����Ϊʵ�ʲ����ʻ�ͳ�Ʋ����ʡ���������Ҫ���ľ���̽�������Excel������ʷ�����ʡ���Excel������ʷ�����ʺܼ����Ľ�չʾ������������������ʵļ�������е㸴�ӡ�������Ҳ������Excel���������������ͨ�� ��Ȩ�ļ۸�������㡣���⣬ʵ���ϻ��в���������Ĵ��ڣ�Ҳ���ǰ��ղ�ͬ����Ȩ��Ȩ�ۺͲ�ͬ������չʾ����������������ˮƽ����������һ�����⣬��������Ҫ̽�ֵľ��������Excel����Ƚϼ���ʷ�����ʡ� 1.Collect your raw data, in the form of a closing price for each time period. Many people do not know, but Yahoo Finance is a good source of daily data that can be downloaded into a spreadsheet.Your data will likely include other data points such as high, low, volume, etc, but just ignore everything except the close. ���������Ѽ�ÿһ��ͳ��ʱ������̼�ԭʼ���ݡ��ܶ��˲�֪���Ż��ƾ���վ�Ǹ��dz��õĵ��ӱ�������������Դ�������п��ܻ�������ۣ���ͼۣ��ɽ������������ݣ���ֻ�������̼ۣ������ľ��ɷ����� 2. The first step is to convert the prices into a return series. Again, let��s not dig too deeply into the theory in this post, but prices are somewhat arbitrary. Is a $50 price a change a lot? Well, that depends on the price of the asset and how much prices usually change. Converting to returns is nothing more than changing the price series into a series of percentage changes. This is the first step in nearly all quantitative or mathematical market analysis. In Excel, start at the second price from the top in your series (assuming closing prices are in a column with the newest price at the bottom). In the cell to the right of prices, divide the second price by the first and subtract one, as in the pic. Copy this formula down the entire column. ���ݼӹ���һ���� �������̼ۼ����һϵ�лر������ݡ����IJ�������̽������֪ʶ�����ɽ��۶�����Щ����ԣ�żȻ�ԡ�50��Ԫ���ǵ��������Ǻܴ�ı仯����ÿ��ʲ��۸�ľ���ֵ��С�Լ�ͨ���ļ۸�䶯���ȡ������̼�ת���ɻر���ֻ�����ǽ�һϵ�еijɽ���ת����һϵ�еİٷֱȲ��������Ǽ�������������������ͳ��Ϊ������ �г������ĵ�һ����������Excel���гɽ��������ǰ����ϵ��µ�˳�����еģ��ȴӵڶ����ɽ��ۿ�ʼ���ڵڶ����ɽ����ұߵ��������õڶ����ɽ��۳��Ե�һ���ɽ��ۣ��ټ�ȥ1��Ȼ��ѹ�ʽ��������һֱ�����һ���ɽ������ڵ�λ��Ϊֹ������ͼ�� 3. Next, find the standard deviation of the returns. The formula for standard deviation in Excel is =STDEV(��), and takes a range of prices as an input. In the graphic, I have calculated a 10 day standard deviation of prices, but that is for the illustration only. Set your window to whatever time period you want to evaluate, and, again, copy the formula down. Twenty days is a good starting point if you haven��t done this analysis before. ���ݼӹ��ڶ����� ����һϵ�лر��ʵı��Excel�б�����㹫ʽΪ=STDEV(��)����Ҫ��ȷ��һ���������ڣ�������ͼ��ѡ����10����Ϊ����������ڣ�����������ʾ˵�����ڵ�10���ر������ֵ��Ҳ������ñ��ʽ�����10��ı��ͬ���������Ƶ����һ���ɽ�������λ�á������ǰû���������������20����Ϊ���������Ǹ�������ѡ�� ![]() 4. So far, the procedure has been straightforward: calculate a return series, and then calculate the standard deviation of that series. There is one more step, which is perhaps the only part of this that is conceptually a little bit complicated. You have calculated the standard deviation of the returns for whatever the time interval of your data is. If you have daily data, you have calculated a daily standard deviation, and so on for hourly, weekly or any period. Historical volatility is the annualized standard deviation of returns. We must multiple the standard deviation by an annualization factor, which is the square root of how ever many of your periods are in a year. This example is daily data; there are 262 trading days in a year, so we multiply the standard deviation by SQRT(262). If you are using weekly data, the annualization factor is SQRT(52), etc. ��ĿǰΪֹ���������������ֱ�ף��ȼ���ر��ʣ��ټ��������滹��һ�����裬����ֻ�����ⲽ�������Ƚϸ��ӵĸ������ĿǰΪֹ���Ѿ��ó��ر��ʵı������ѡ������������Ƕ��١�����õ���ÿ�ճɽ������ݣ�������ľ����վ����ͬ�����õ���ʲô���ڵ����ݣ��ó��ľ���ʲô���ڵı���Դ����ơ���ʷ�������ǻر��ʵ��껯���������DZ����ü�������ı�������껯���ӣ�Ҳ������ѡ�������������һ�����ж��ٸ�����������ݵ�ƽ���������վ�����Ϊ��������һ����262�������գ���ô���Ǿͻ���=SQRT(262)������껯���ӣ�Ȼ������վ�����������������һ�ܣ���ô�껯���ӵ���SQRT(52)���Դ����ơ� This is one example, but a slightly more complex example, with graphs, can be found step by step on the tabs in this spreadsheet. We will consider exactly what this measure of volatility is, what it does, what we can do with it, and, even more importantly, what��s wrong with it in a future post. ��������Ѷ��е��ÿһ������涼����ͼ�����Ժ����ǻ�̽�ֲ����ʾ�����ʲô������ʲô���ã���������������ɶ���Լ�����Ҫ�ģ�������Щȱ�ݡ� Edit: This sheet and article use an annualization factor of 262. There is some debate over what number to use here, but you��ll see it doesn��t really make much of a difference. 252 is probably the most accurate number (and is what I use in my calculations now), but, as long as you��re consistent in your calculations, the actual number doesn��t really matter. ����˵�����������껯��������262������������ģ���Щ�˶Դ������飬�������IJ���ȷ������Ӧ����һ����252�����գ��������Ƕ��٣�ֻҪ�ڼ��������һֱ����ȥ��ʵ�ʽ�������д������ ����ע�����ղ������裬���ٱ��ն�500ָ�����ƵĽ�����������SPYΪ��������һ��SPY����ʷ�����ʡ� �ڶ�����ԭʼ����ɸѡ�� ���غ�ԭʼ���ݸ�ʽ���� ȥ�����̼ۣ���ۣ���ͼۣ��ɽ�����û�õ����ݣ�ֻ���¾�����������̼� ������������ر��ʡ� ����ɸѡ��ɣ�A��Ϊ�Ӿɵ��µ��������У�B��Ϊ������������̼ۣ�C��Ϊ�ر��ʡ����磬��C3������8��14�����̼۱�ǰһ�����յ�ͬ�Ȳ��� ���Ϊ283.899994/282.100006-1=0.64% ��갴סC3���������ù�ʽ����������2018-9-13�ɽ��۴����ó����һ����SPY�Ļر��� ���IJ�������ر��ʵı�� ���ʽΪ=stdev()����������ѡ�����ÿ5��ı����ˣ����ڵ����ݷ�ΧΪC3��C7����������������ΪD7 �����ʾ2018-8-14��2018-8-20��5��������SPY�Ļر���Ϊ0.61% ��갴סD7���������ù�ʽ����������2018-9-13�ijɽ��۴����ó����һ����SPY�ı��� ���IJ���������껯������ ����һ����252�������գ��껯���ӵĹ�ʽΪ=SQRT(252)�����������ΪE7 ���ս����2018-8-13��2018-9-13�ڼ�SPY��5���վ���ʷ������ |